Graphical reporting system
Design, build and document a graphical reporting system.

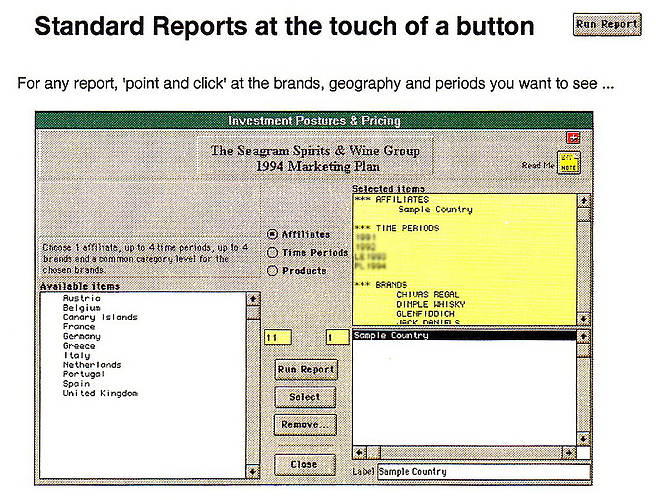
While working as a contractor to Seagram, Paola found an innovative way to generate coloured charts in Omnis at a time when no tools existed for creating graphical reports with Omnis.
At that time, Omnis did not include a tool to create graphical reports, and the only available graphing tool for use with Omnis (GraphIT!) was unstable.
Paola realised that Omnis Notation (like DOM, today), could be used to generate coloured charts from the database. She created a set of templates using drawing objects. Notation allowed every Omnis "format" (file) and each format element to be accessed and set.
Paola developed procedures which gathered information from the Sybase database, opened the template and adjusted the attributes of its elements according to the data.
She also developed a library of general-purpose database access procedures to help the development process for the project team.


